Are you interested in decentralized finance? Chances are, Dune has a place in your bookmarks. A platform for analyzing data from numerous blockchains, it allows users to create and share charts and other information. So you can visualize everything that’s going on. In this article, we’ll show you what you can do with Dune, as well as a simple example of how to create a dashboard.
Want to be your own bank? Choose a Ledger wallet (commercial link) >>
Estimated reading time : 10 minutes
General presentation of Dune
What is Dune?
Dune is a web platform that allows users toanalyze and visualize data on different blockchains.
This data is extracted into a PostgreSQL database to make it easier to manipulate. Users can query this database using SQL queries to retrieve and analyze the data they require. The results can then be presented in the form of graphics, tables or text.
Everyone is free to create their own dashboard or consult those of others. The platform is designed to be easy to use, even for those new to data analysis and programming. The site is powered by its community. Help is readily available in the documentation provided. Users and developers on their Discord or GitHub are also a source of help in the event of problems.
Dune brings together analysis tables from a wide range of Web 3 sectors, from very specific applications such as Uniswap to whole swathes of the industry such as layer 2 or NFTs.
At present, the platform operates with a fifteen or so compatible EVM blockchains, plus Bitcoin and Solana.
The aim of its creators is to make Web 3 data accessible to everyone. This is surely one of the reasons why the tool is completely free and open source. For experts or enterprises, two paid versions are also available at $399/month or $999/month, allowing you to extract more data and create more private dashboards.
Platform history
Dune was created in 2018 by its two Norwegian founders Fredrik Haga and Mats Olsen.
Both fans of Ethereum and strong believers in its world-changing potential, they launched Dune Analytics because of the difficulty at the time for users to understand and analyze blockchain data.
After a difficult start, the project largely succeeded in breaking through, raising US$79.4 million in three rounds from 21 investors. Investors include Coingecko, DragonFly and Multicoin Capital.
Initially working only with Ethereum, Dune has integrated other blockchains over time. The tool is constantly improving and will certainly support more and more blockchains in the future.
The platform currently boasts over 100,000 users per month, and more than 10,000 dashboards have already been created.
Features offered by Dune
To exploit Dune’s full potential, you’ll need to create an account on the platform. Click on « Sign up » in the top right-hand corner, choose a username and password, enter your email address and that’s it.
View other people’s dashboards
With over 10,000 searchable dashboards, chances are you won’t need to create your own. Someone else may already have done it for you!
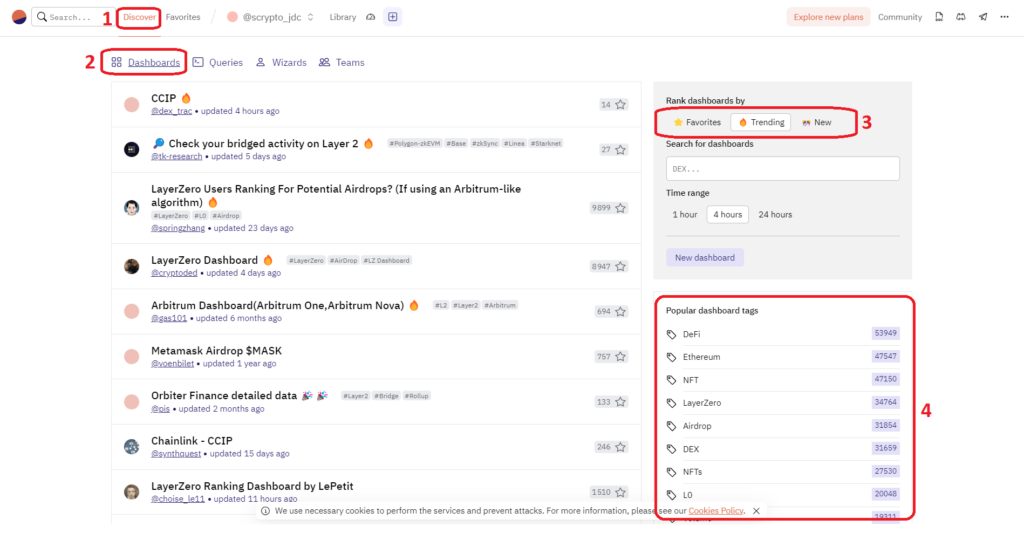
To see which ones are available, click on « Discover » (1) and then on « Dashboards » (2). You’ll then see the most popular of the moment or the most recent, depending on your selection (3).
You can select the popular keywords suggested in (4) or enter what you’re looking for directly into the search bar.

Once you’ve found the one you’re interested in, click on it to see the associated data.
When data is displayed in tabular form, it is often possible to search within the table using the bar below (5).

Clicking on a title (6) displays the code used to extract and present the data below. You can then copy it and modify it as you wish using the « Fork » button (7).

>> Put your cryptocurrencies in the green. Choose a Ledger wallet (commercial link) <<
Create your own dashboard
If you’re not happy with other people’s dashboards, you can create your own. As an example, we’ll create one with you in the following paragraphs.
You can find this dashboard on Dune by following this link to view the code directly.
Create dashboard and add text
To create your dashboard, click on « New Dashboard » (1). Fill in the required data and confirm with « Save and open » (2). If you don’t want it to be public, check the box (3).

You’ll then see a blank, customizable dashboard. To modify it, go to « Edit » (1). You can then add text using the « Add text widget » button (2), or data using SQL queries with « Add visualisation » (3).

In the image above, we’ve added a text insert (2). The syntax for adding effects (bold, italic…) or links can be displayed by clicking on « Some markdown is supported » (4).
After confirming with « Save », you can move the added elements and/or change their size as you wish.
Add graphics
To add graphics, several options are available.
Those who already have a good grounding in programming can start from scratch.
For the rest of us (and time-saving experts), Dune’s strength lies in its extensive library of pre-written queries. It’s also possible to copy and modify the query code found in other people’s dashboards, as explained above. All the same, you’ll need a basic understanding of programming to understand what you’re doing.
To create new queries, go to the « Discover » menu (1) and then to « Queries » (2). Here you can view queries proposed by other users. As with the dashboards, you can sort them by release date or popularity, and display the ones that interest you by keyword.

If you find one that suits you, you can retrieve it and modify it by clicking on « Fork ». If you don’t find anything, you can start from scratch by clicking on « New query » (3).
You’ll find an entire command library on your left (4). Enter your query code in the black box (5). To run and test it, click on « Run ». (6)
Here, to take a simple example, we’ve written code to display the number of deposits on polygon of an EVM address created for the occasion. By forking this code, you can replace it with your own, or change the blockchain by replacing polygon with the one you want. You can also increase the number displayed by sending a donation on polygon to the address 0x453C326D337F0a125C7ddc8c148aE8a9f3BbB9c6.
Here’s the code:
SELECT
COUNT(*) AS num_deposits
FROM
polygon.transactions
WHERE
to = 0x453C326D337F0a125C7ddc8c148aE8a9f3BbB9c6

To visualize the result, we add a counter by clicking on « New visualisation » (7). To add the counter to your dashboard, click on « Add to dashboard » (8).

You can then consult it and position the various inserts as you see fit.
To share it, you can use the « Share » button (9) at top right to see the link associated.
In the dashboard above, you’ll also find a counter of the number of transactions for the same address on the polygon blockchain, whose code you can check out as an example.
In conclusion
Dune is a very practical tool that allows you to access on-chain data more easily than directly from blockchains. The graphs offered make it possible to visualize at a glance data that may be more difficult to understand when presented otherwise.
If you have no programming background, the numerous dashboards created by other users are likely to meet your expectations.
If, despite everything, you still can’t find what you’re looking for, you can turn to the other platforms we’ve presented in this article such as DefiLlama.
In any case, we look forward to seeing you next week to discover a new DeFi tool.
Need a secure wallet to explore the many applications of DeFi? The best solution is still a personal hardware wallet. At Ledgerthere’s something for every profile and every crypto. Don’t wait to secure your capital (commercial link)!