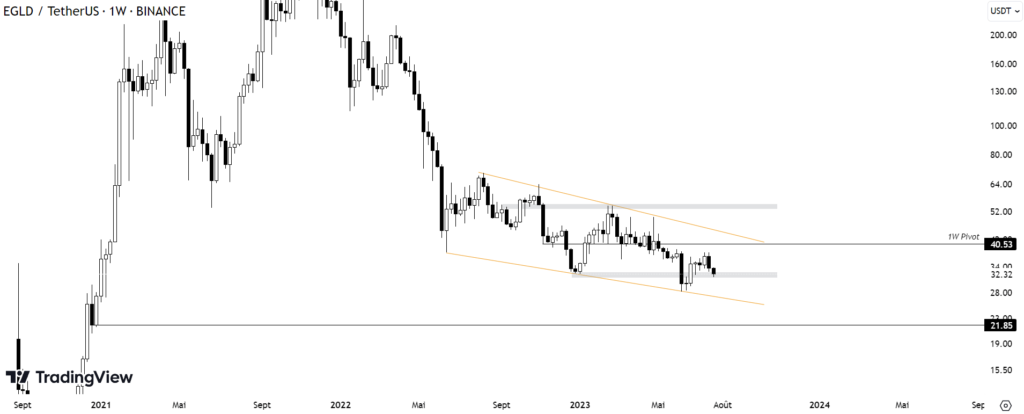
In this new crypto nugget, your weekly column dedicated to the analysis of an altcoin, we take a look at the MultiversX project’s EGLD cryptocurrency. In the midst of a battle to hold the $30 mark for several months, will it finally manage to take off towards higher technical levels? Or will it give in to selling pressure and head for the $20 mark? That’s what we’re going to find out on TradingView.
Want to add bitcoins to your wallet? Register with Binance and save 10% on fees <<
A weekly trend punctuated by a range

Since May 2022, EGLD has been moving in a descending wedge (shown in orange). In addition to this technical figure, EGLD is also in a technical range, with an upper bound at $53.30/$55 and a lower bound at $31.4/$32.6. Within this range lies a weekly pivot (1W Pivot) at $40. When the price is above this level, the chances of a return to the upper limit are greater, and vice versa when EGLD is below it.
For the moment, there’s nothing special to report on the weekly scale, as EGLD is still within the technical range. However, as it is currently on the lower boundary following a bearish excess during the month of June, it seems appropriate to buy if you simply wish to play for a technical rebound by speculating on EGLD’s continued movement within the range.
However, for EGLD to at least return to its upper boundary, it will have to break free of the weekly pivot at $40, which we can regard as major resistance. Until this technical level is regained, the chances of a return to $53.30 are slimmer. What’s happening on the daily scale? Let’s take a closer look on a smaller time scale.
EGLD faces a wall of resistance, will buyers cope?

On the daily time unit, we can see that EGLD is currently building a second range on the lower bound of the weekly range, reflecting much lower volatility over the past few weeks. As long as EGLD remains between $37 (upper bound) and $32, volatility will be virtually non-existent, leading to the continuation of the grey scenario shown on the chart.
However, there are two other scenarios shown in black. While the bearish scenario will result in a return to the June lows before seeking support from the ascending wedge, the bullish scenario is different. Should EGLD manage to break above $37, it will quickly find itself confronted by the weekly pivot at $40 and a second resistance level at $44. All these technical levels will have to be regained for buyers to see a validation of the bullish scenario, with a return to the weekly high at $53.50.
EGLD versus Bitcoin: a rather favourable situation

To conclude our analysis of EGLD, let’s admit that its situation is rather interesting against the king of cryptocurrencies if you want to place yourself on the buy side to speculate on a rebound in the coming weeks. For several weeks now, the technical level (formerly a resistance, shown in blue) has been well defended, which could suggest a rebound for EGLD against the king of cryptocurrencies very soon.
If this is the case, there’s a good chance that EGLD will be able to regain its position of early 2023 against BTC, which would enable the pair against the dollar to regain strength in order to bounce off the lower boundary of the current range.
This concludes our analysis of EGLD. It’s clear that the technical confluence between EGLD/USDT and EGLD/BTC is very interesting, increasing the likelihood of a technical bounce, although we can’t say for sure. As a result, if bitcoin continues to lateralize but Ethereum pulls out all the stops in search of new resistance, it’s possible that EGLD could gradually move towards $55, provided it regains the weekly pivot at $40. For the time being, with nothing confirmed, it seems important to prepare for a bearish scenario with a return to the lower boundary of the descending wedge at $26.
Looking for tokens with high growth potential? Binance Launchpad is exclusively highlighting promising crypto projects. It’s easy to get involved. Just register with Binance by following this link, you’ll get a 10% discount on your trading fees (commercial link).