In this new weekend analysis, we’ll be updating our previous weekend crypto update, which will enable us to identify the technical thresholds to watch over the coming weeks on the cryptocurrencies. With July now underway, will the market stop moving in a range in order to resume a clear direction? Without further ado, let’s go straight to TradingView to kick off this weekend’s crypto update!
Want to add bitcoins to your wallet? Register with Binance and save 10% on fees <<
Market capitalization needs to break through resistance to push higher

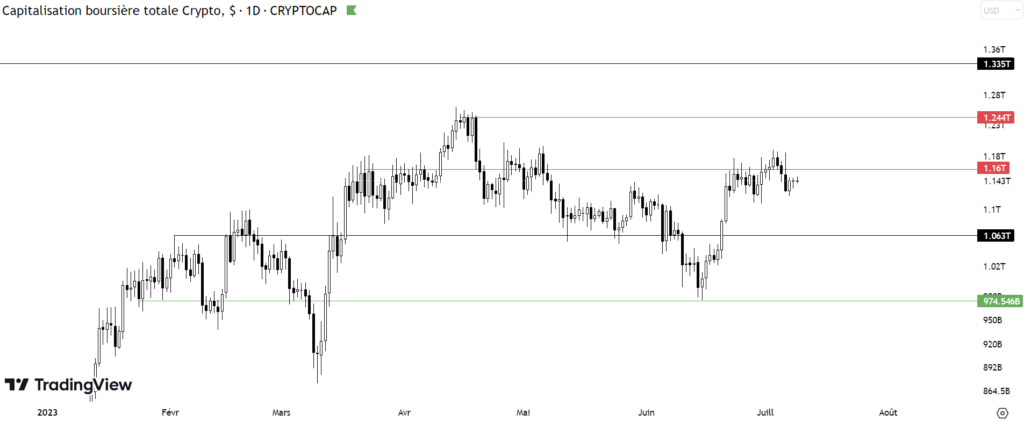
Since last week, we’ve been updating our charts with more precise levels, since the weekly scale only gives a global view of prices. Here, we can see that cryptocurrency prices has been trading below a technical threshold at 1,160 billion.
As long as this level acts as resistance, it will be complicated for the cryptocurrency market to continue its upward momentum, initiated during the month of June. Currently in a range phase, a clear rejection of the current level with a move below $1,063 billion will be a negative sign, leading us to consider a return of capitalization to the June low of $974 billion.
Altcoins still dominated by sellers

Over the past few months, we have noticed that altcoins are moving in a technical range between $290 and $400 billion. After losing the range pivot at $337 billion during late May, leading to a powerful fall on support, altcoins had the opportunity to rebound, but are now moving below the pivot which operates as resistance.
The altcoins course is below this technical threshold, demonstrating the lack of buyer interest in this asset class for the time being. However, if capitalization were to break above this pivot point, it would be a rather bullish sign, leading more altcoins to post strong gains.
In this context, a return to $400 billion is possible. However, we’re not there yet, as we’ll see when we look at the ETH/BTC pair. As for the bitcoin’s dominanceAs the situation is identical to last week, it’s not really relevant to talk about it again, since the objectives and theses set out last week have not changed.
Ethereum under resistance against bitcoin, a bad sign for cryptocurrencies

Since last week, Ethereum continued to maintain the bearish momentum in which it has been evolving for several weeks. Currently below a technical level of $0.062, Ethereum is underperforming the king of cryptocurrencies. Having built up resistance (red zone) over the last few days, ETH will need to break free of this as soon as possible if it is to limit its downward momentum.
When ETH is in trouble against the king of cryptocurrencies, this usually results in a period of price lateralization (which is currently the case). As a result, altcoins don’t have a bullish « narrative » in the sense that Ethereum, when outperforming, temporarily takes bitcoin’s place to lead the market with nice bullish periods. For the time being, until the red zone is breached on the upside, it will be difficult to envisage altcoins rebounding to higher levels.
DeFI cryptocurrencies are still below a major technical zone

For the capitalization of the DeFIThe situation is identical to that of the altcoins, with the price below a broad resistance zone (horizontal and oblique resistance). For an upward dynamic to really get underway, in addition to the need for ETH to be in an outperformance situation, altcoins will have to break out of their pivot, enabling DeFI’s capitalization to break through the current resistance zone.
This brings us to the end of this weekend’s crypto update. It has to be said that, since last week, ETH has continued to underperform, bitcoin’s dominance is still in a strong position and altcoins are below a pivot. The market is clearly wait-and-see, the perfect example of the dynamic we were expecting from the summer a few months ago. For things to change, in addition to bitcoin holding on to its supports, ethereum will have to pull its weight, enabling the rest of the market to move higher.
Looking for tokens with high growth potential? Binance Launchpad is exclusively highlighting promising crypto projects. It’s easy to get involved. Simply register with Binance by following this link, you’ll receive a 10% discount on your trading fees (commercial link).